Edit chart
Loading graph
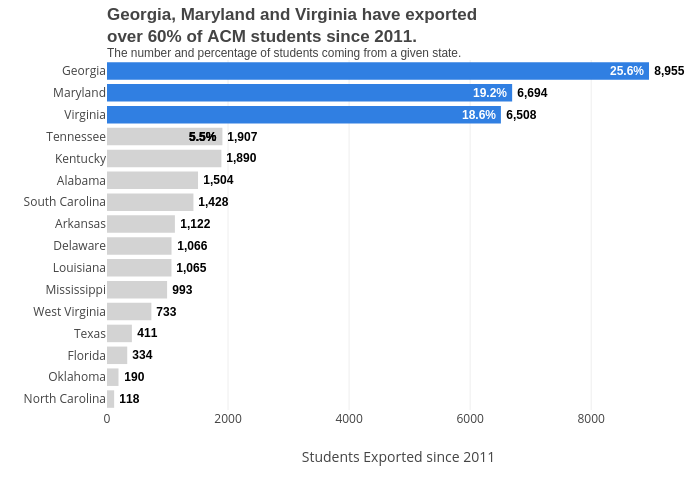
Melissajuarezc's interactive graph and data of "Georgia, Maryland and Virginia have exported over 60% of ACM students since 2011. The number and percentage of students coming from a given state." is a bar chart; with Students Exported since 2011 in the x-axis. The x-axis shows values from 0 to 0. The y-axis shows values from 0 to 0. This visualization has the following annotations: 25.6% ; 19.2% ; 18.6% ; 5.5% ; 5.5% ; 5.5% ; 8,955 ; 6,694 ; 6,508 ; 1,907 ; 1,890 ; 1,504 ; 1,428 ; 1,122 ; 1,066 ; 1,065 ; 993 ; 733 ; 411 ; 334 ; 190 ; 118 ; Source: SREB's ACM Data