Edit chart
Loading graph
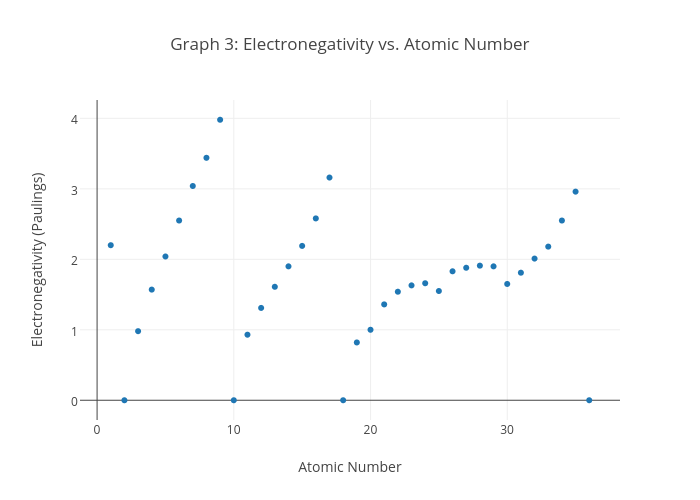
Melina's interactive graph and data of "Graph 3: Electronegativity vs. Atomic Number" is a scatter chart, showing Col2; with Atomic Number in the x-axis and Electronegativity (Paulings) in the y-axis.. The x-axis shows values from -1.107843137254902 to 38.1078431372549. The y-axis shows values from -0.2640953862104718 to 4.244095386210471.