Edit chart
Loading graph
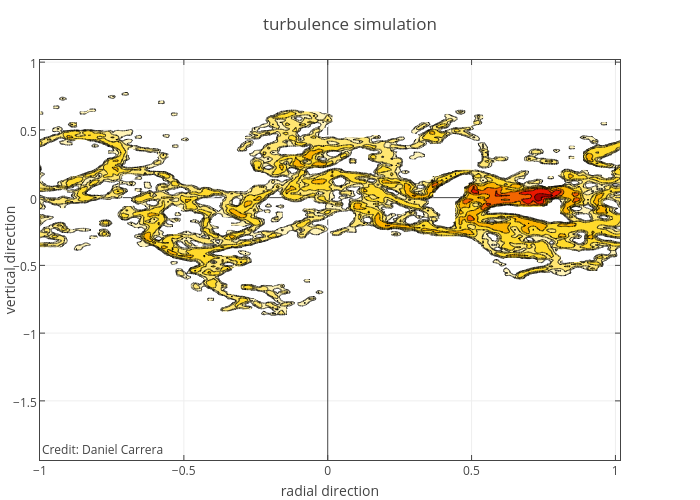
Mdtusz's interactive graph and data of "turbulence simulation" is a contour; with radial direction in the x-axis and vertical direction in the y-axis.. The x-axis shows values from -1 to 1.0158730158730158. The y-axis shows values from -1.9365079365079365 to 1.0158730158730158. This visualization has the following annotation: Credit: Daniel Carrera