Edit chart
Loading graph
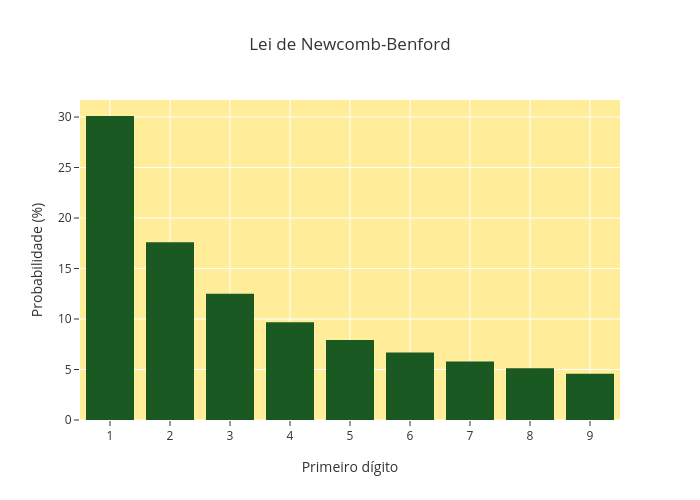
Mdspena's interactive graph and data of "Lei de Newcomb-Benford" is a bar chart; with Primeiro dígito in the x-axis and Probabilidade (%) in the y-axis.. The x-axis shows values from 0.5 to 9.5. The y-axis shows values from 0 to 31.687367964629594.