Edit chart
Loading graph
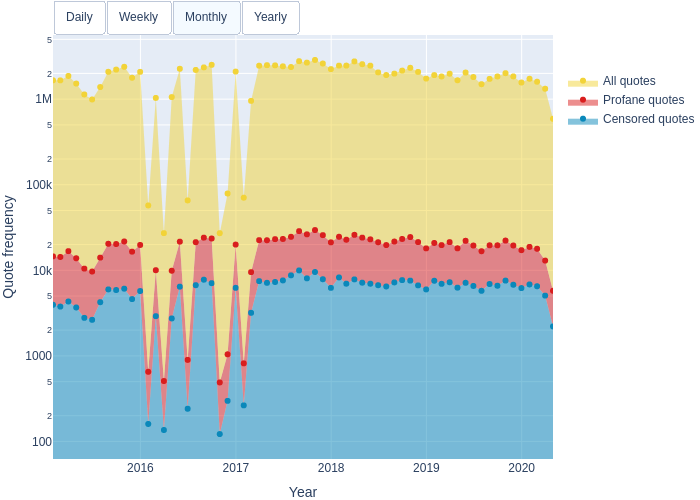
Mculyak's interactive graph and data of "" is a filled line chart, showing Censored quotes, Profane quotes, All quotes; with Year in the x-axis and Quote frequency in the y-axis.. The x-axis shows values from 2015-01-31 to 2020-04-30. The y-axis shows values from 1.8232702396271723 to 6.721343731941483.