Edit chart
Loading graph
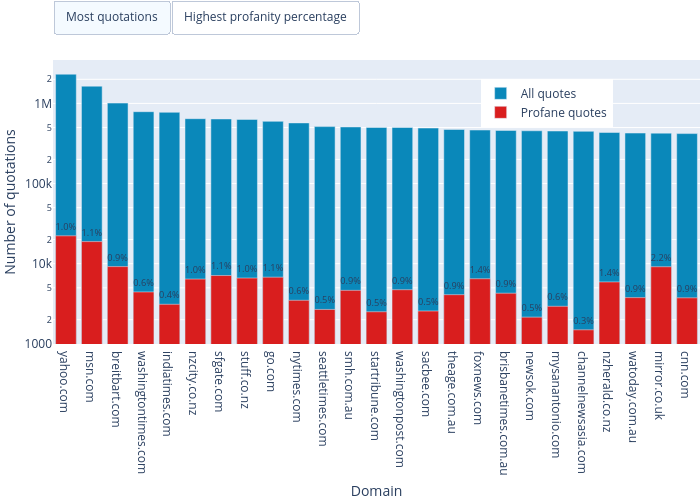
Mculyak's interactive graph and data of "Number of quotations vs Domain" is a overlaid bar chart, showing All quotes vs Profane quotes; with Domain in the x-axis and Number of quotations in the y-axis.. The x-axis shows values from -0.5 to 24.5. The y-axis shows values from 2.9974091342856575 to 6.542050301781463.