Edit chart
Loading graph
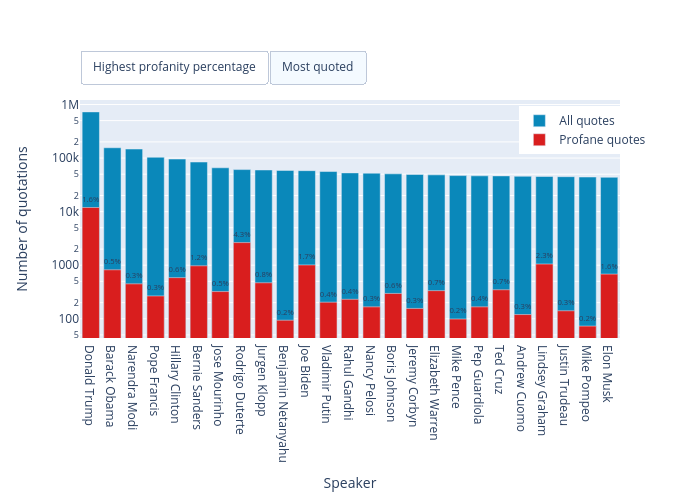
Mculyak's interactive graph and data of "Number of quotations vs Speaker" is a overlaid bar chart, showing All quotes vs Profane quotes; with Speaker in the x-axis and Number of quotations in the y-axis.. The x-axis shows values from -0.5 to 24.5. The y-axis shows values from 1.6411960803575556 to 6.083731675615558.