Edit chart
Loading graph
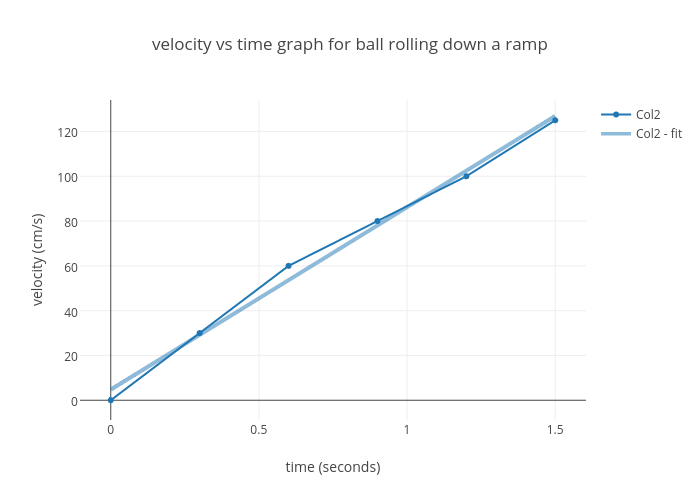
Mbaker2016's interactive graph and data of "velocity vs time graph for ball rolling down a ramp" is a scatter chart, showing Col2 vs Col2 - fit; with time (seconds) in the x-axis and velocity (cm/s) in the y-axis.. The x-axis shows values from -0.09705124534783856 to 1.5970512453478385. The y-axis shows values from -8.618824579011934 to 134.03758224601316.