Edit chart
Loading graph
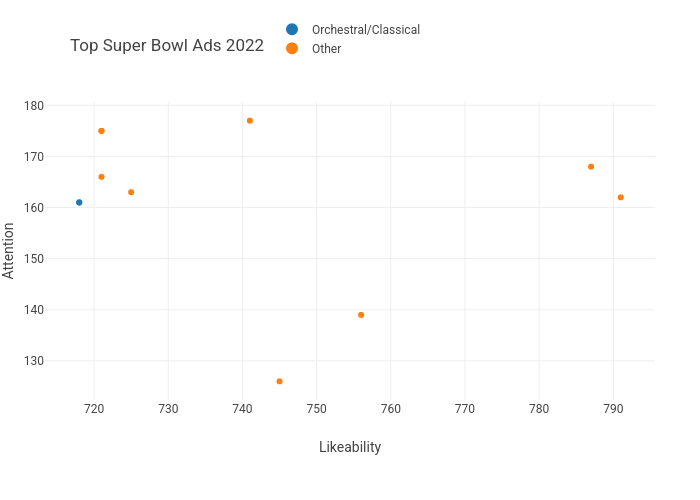
Mauri_sostereo's interactive graph and data of "Top Super Bowl Ads 2022" is a scatter chart, showing Orchestral/Classical vs Other; with Likeability in the x-axis and Attention in the y-axis.. The x-axis shows values from 713.6252099076406 to 795.3747900923594. The y-axis shows values from 122.43035343035343 to 180.56964656964658.