Edit chart
Loading graph
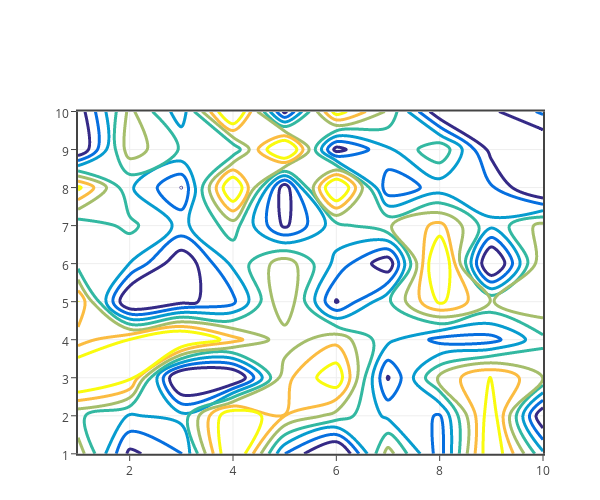
Matlab_user_guide's interactive graph and data of "" is a contour, showing trace0. The x-axis shows values from 1 to 10. The y-axis shows values from 1 to 10.