Edit chart
Loading graph
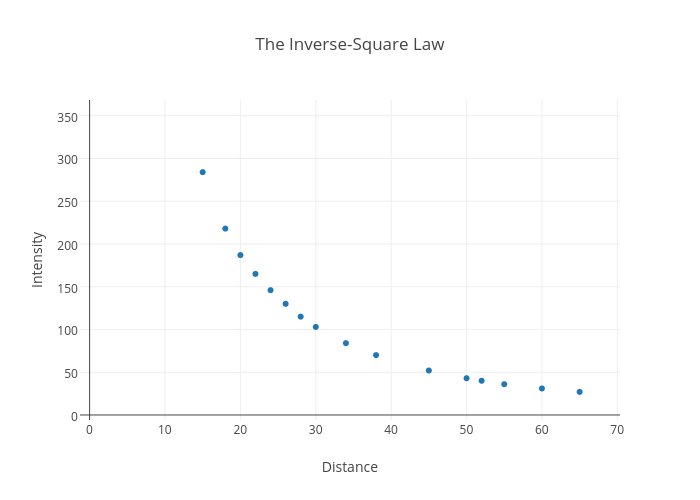
Matildavushaj's interactive graph and data of "The Inverse-Square Law" is a scatter chart, showing Col2; with Distance in the x-axis and Intensity in the y-axis.. The x-axis shows values from -1.2727849309573909 to 70.3536561346086. The y-axis shows values from -5.87825388607223 to 368.3936888857655.