Edit chart
Loading graph
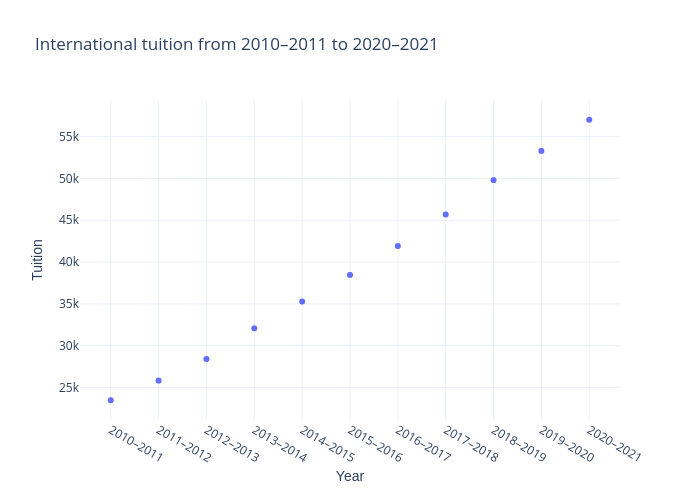
Marta.thevarsity's interactive graph and data of "International tuition from 2010–2011 to 2020–2021" is a scatter chart; with Year in the x-axis and Tuition in the y-axis.. The x-axis shows values from -0.6126644736842106 to 10.61266447368421. The y-axis shows values from 21212.951149425287 to 59285.04885057471.