Edit chart
Loading graph
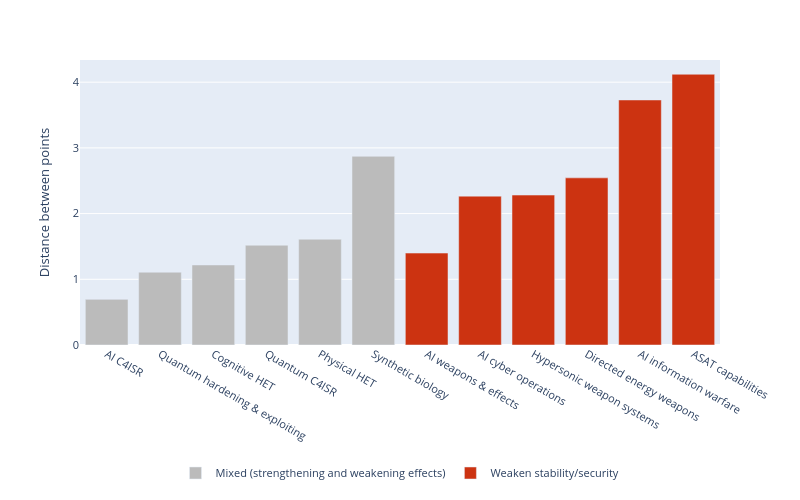
Marinafavaro's interactive graph and data of "Distance between points vs {}" is a , showing Mixed (strengthening and weakening effects) vs Weaken stability/security; with {} in the x-axis and Distance between points in the y-axis.. The x-axis shows values from 0 to 0. The y-axis shows values from 0 to 0.