Edit chart
Loading graph
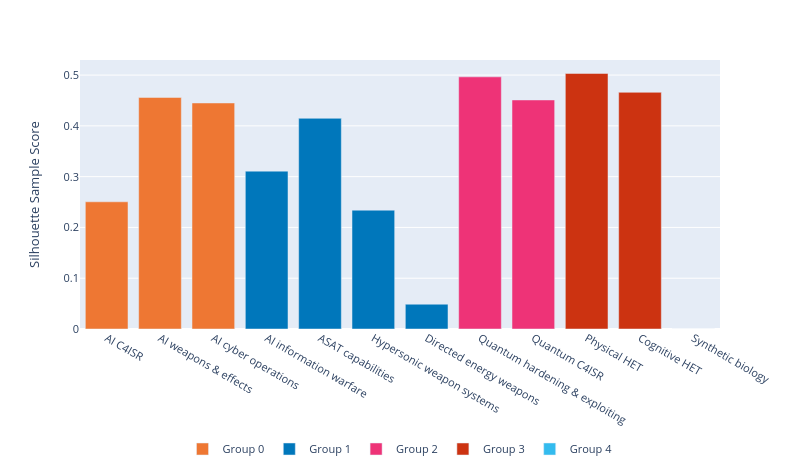
Marinafavaro's interactive graph and data of "Silhouette Sample Score vs {}" is a , showing Group 0, Group 1, Group 2, Group 3, Group 4; with {} in the x-axis and Silhouette Sample Score in the y-axis.. The x-axis shows values from 0 to 0. The y-axis shows values from 0 to 0.