Edit chart
Loading graph
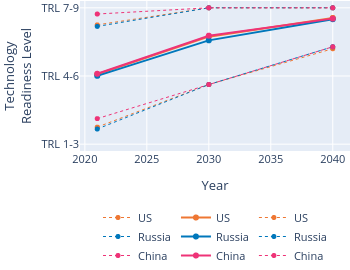
Marinafavaro's interactive graph and data of "TechnologyReadiness Level vs Year" is a line chart, showing US, US, US, Russia, Russia, Russia, China, China, China; with Year in the x-axis and TechnologyReadiness Level in the y-axis.. The x-axis shows values from 0 to 0. The y-axis shows values from 0.9 to 3.1.