Edit chart
Loading graph
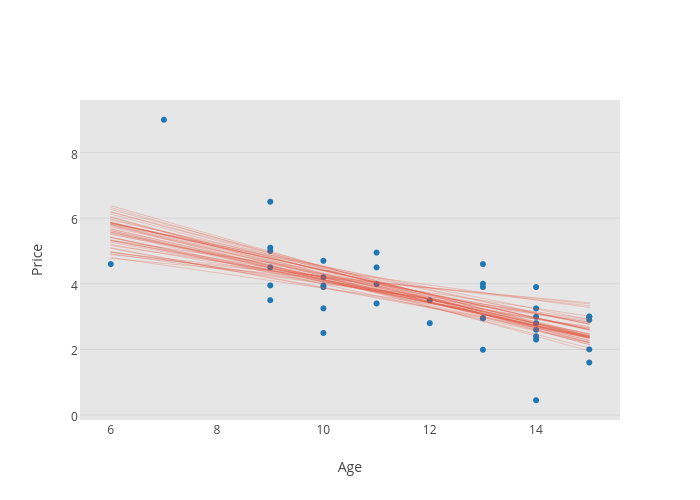
Marianne2's interactive graph and data of "Price vs Age" is a scatter chart; with Age in the x-axis and Price in the y-axis.. The x-axis shows values from 0 to 0. The y-axis shows values from 0 to 0.