Edit chart
Loading graph
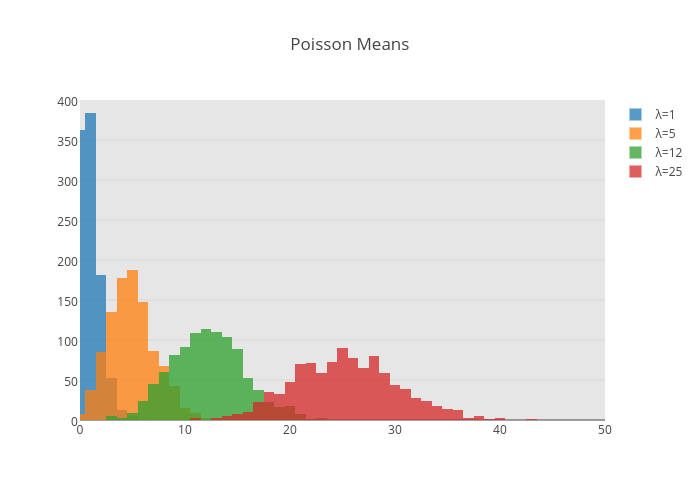
Marianne2's interactive graph and data of "Poisson Means" is a histogram, showing λ=1, λ=5, λ=12, λ=25. The x-axis shows values from 0 to 50. The y-axis shows values from 0 to 400.