Edit chart
Loading graph
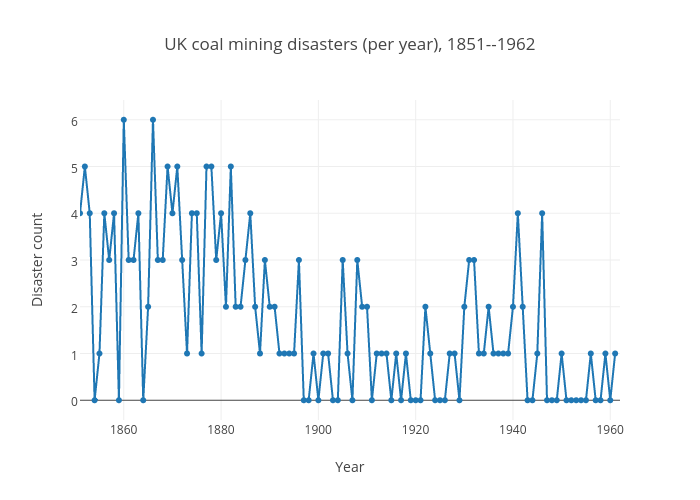
Marianne2's interactive graph and data of "UK coal mining disasters (per year), 1851--1962" is a line chart; with Year in the x-axis and Disaster count in the y-axis.. The x-axis shows values from 1851-01-01 to 1962-01-01. The y-axis shows values from 0 to 0.