Edit chart
Loading graph
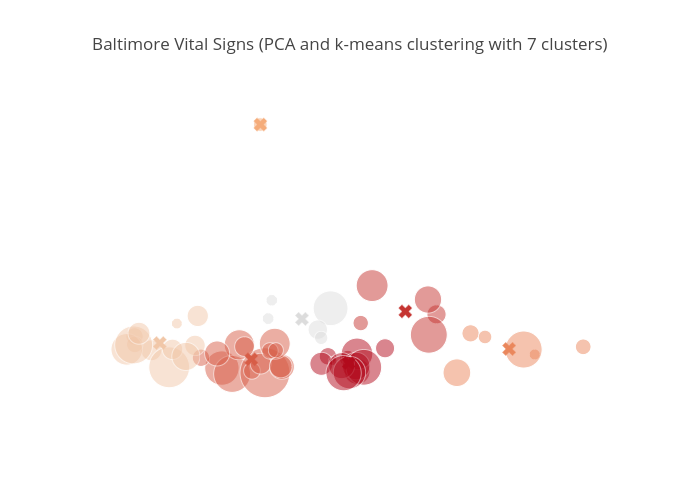
Marianne2's interactive graph and data of "Baltimore Vital Signs (PCA and k-means clustering with 7 clusters)" is a scatter chart, showing vs . The x-axis shows values from 0 to 0. The y-axis shows values from 0 to 0.