Edit chart
Loading graph
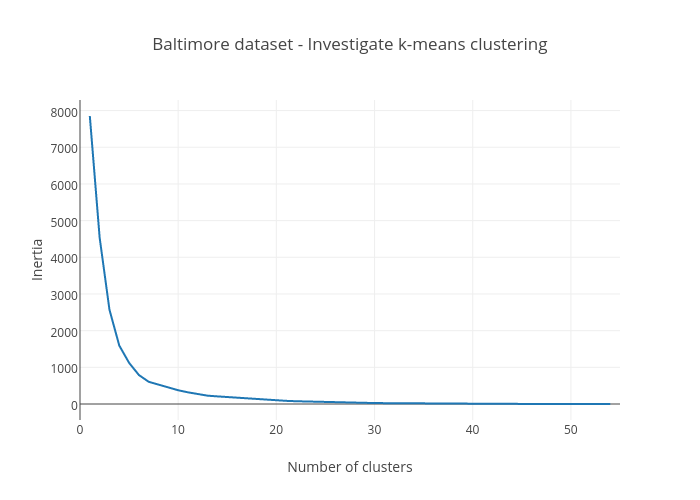
Marianne2's interactive graph and data of "Baltimore dataset - Investigate k-means clustering" is a scatter chart; with Number of clusters in the x-axis and Inertia in the y-axis.. The x-axis shows values from 0 to 55. The y-axis shows values from 0 to 0.