Edit chart
Loading graph
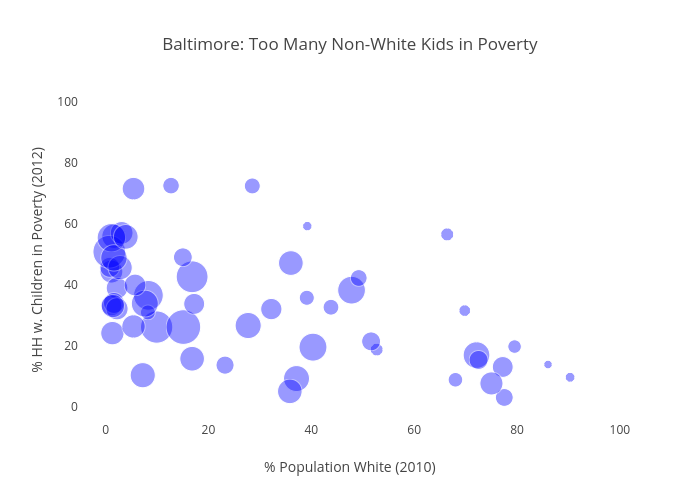
Marianne2's interactive graph and data of "Baltimore: Too Many Non-White Kids in Poverty" is a scatter chart; with % Population White (2010) in the x-axis and % HH w. Children in Poverty (2012) in the y-axis.. The x-axis shows values from -5 to 100. The y-axis shows values from -5 to 100.