Edit chart
Loading graph
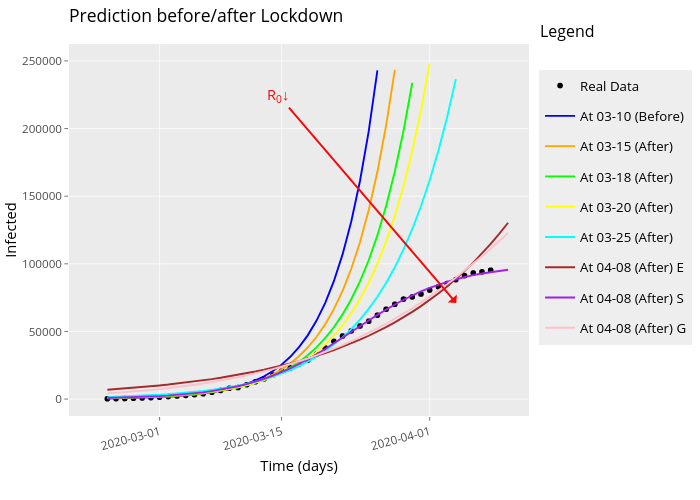
Marcasti's interactive graph and data of "Prediction before/after Lockdown" is a scatter chart, showing Real Data, At 03-10 (Before), At 03-15 (After), At 03-18 (After), At 03-20 (After), At 03-25 (After), At 04-08 (After) E, At 04-08 (After) S, At 04-08 (After) G; with Time (days) in the x-axis and Infected in the y-axis.. The x-axis shows values from 18311.6 to 18364.4. The y-axis shows values from -12500 to 262500. This visualization has the following annotations: Legend; R0↓