Edit chart
Loading graph
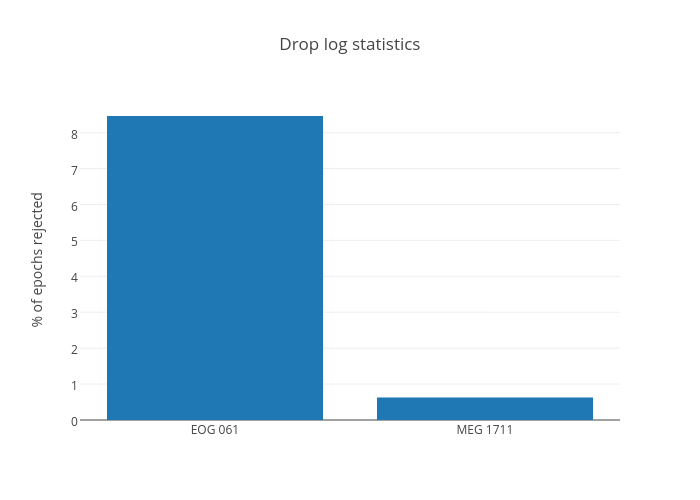
Mainakjas's interactive graph and data of "Drop log statistics" is a bar chart; with % of epochs rejected in the y-axis. The x-axis shows values from 0 to 0. The y-axis shows values from 0 to 0.