Edit chart
Loading graph
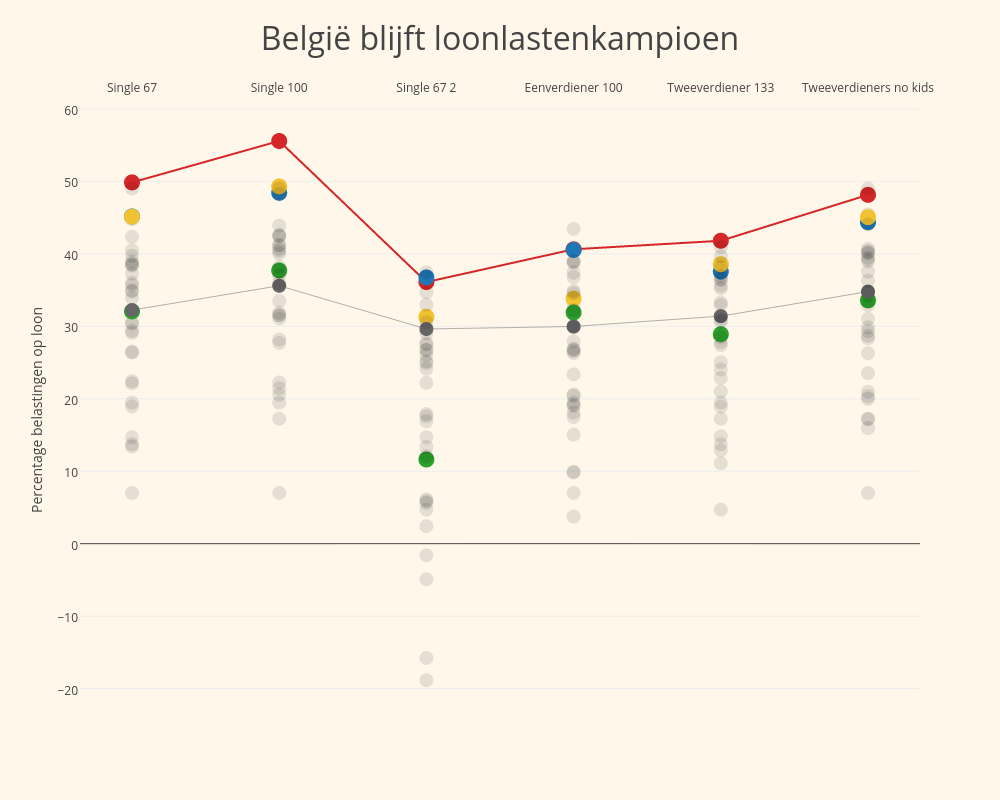
Maartenzam's interactive graph and data of "België blijft loonlastenkampioen" is a scatter chart, showing Australia, Austria, Belgium, Canada, Chile, Czech Republic, Denmark, , Finland, France, Germany, Greece, Hungary, Iceland, Ireland, Israel, Italy, Japan, Korea, Luxembourg, Mexico, Netherlands, New Zealand, Norway, OECD - Average, Poland, Portugal, Slovak Republic, Slovenia, Spain, Sweden, Switzerland, Turkey, United Kingdom, United States; with Percentage belastingen op loon in the y-axis. The x-axis shows values from -0.36178738847724184 to 5.361787388477242. The y-axis shows values from -24.336495132127958 to 61.2390264255911.