Edit chart
Loading graph
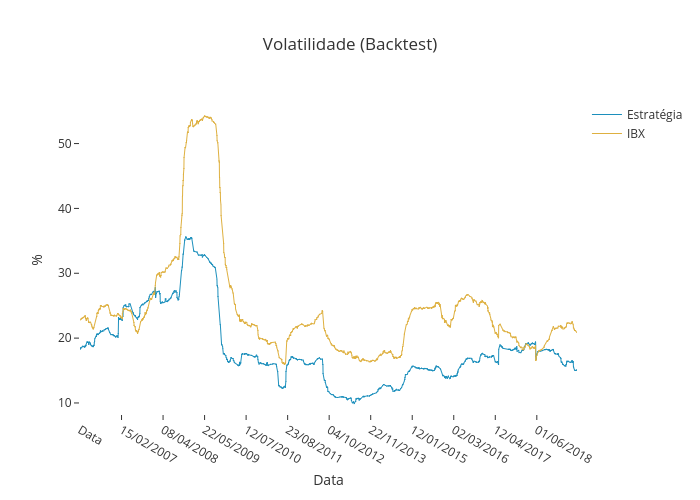
Lucianobfranca's interactive graph and data of "Volatilidade (Backtest)" is a line chart, showing Estratégia vs IBX; with Data in the x-axis and % in the y-axis.. The x-axis shows values from 0 to 3339. The y-axis shows values from 7.372777777777777 to 56.71722222222222.