Edit chart
Loading graph
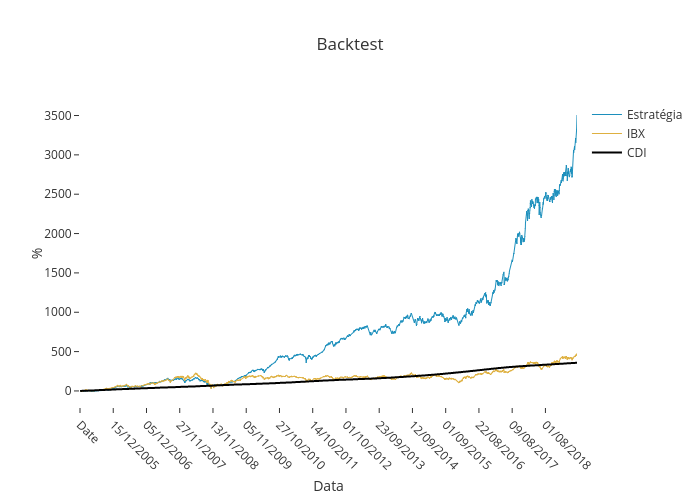
Lucianobfranca's interactive graph and data of "Backtest" is a line chart, showing Estratégia, IBX, CDI; with Data in the x-axis and % in the y-axis.. The x-axis shows values from 0 to 3588. The y-axis shows values from -204.0555555555556 to 3697.0555555555557.