Edit chart
Loading graph
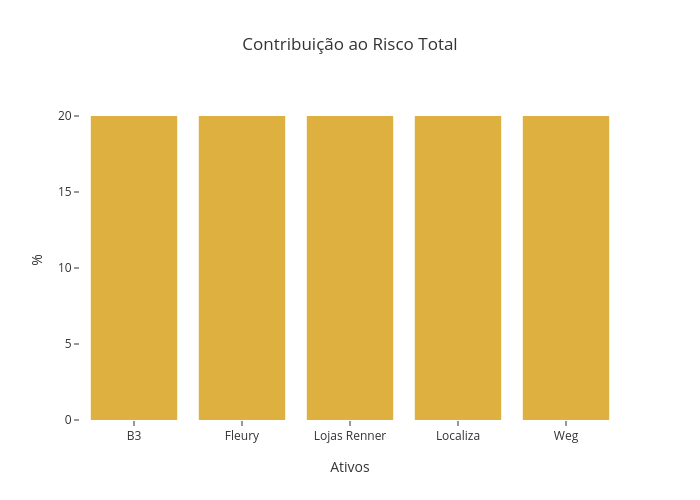
Lucianobfranca's interactive graph and data of "Contribuição ao Risco Total" is a bar chart; with Ativos in the x-axis and % in the y-axis.. The x-axis shows values from -0.5 to 4.5. The y-axis shows values from 0 to 21.05263157894737.