Edit chart
Loading graph
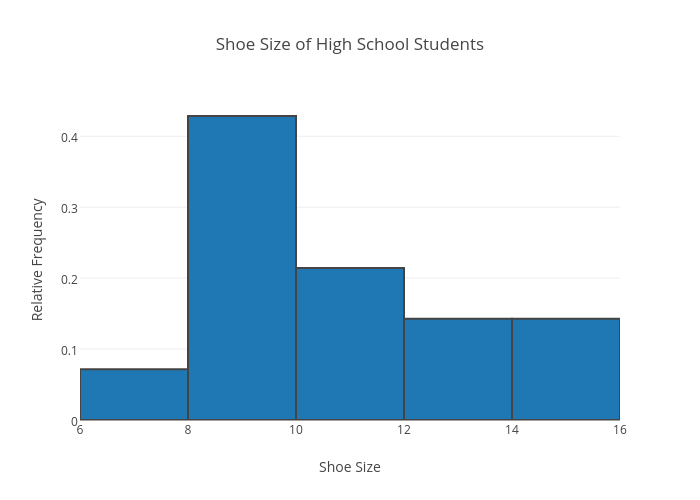
Lucas.dykstra's interactive graph and data of "Shoe Size of High School Students" is a histogram, showing x; with Shoe Size in the x-axis and Relative Frequency in the y-axis.. The x-axis shows values from 6 to 16. The y-axis shows values from 0 to 0.45112781954887216.