Edit chart
Loading graph
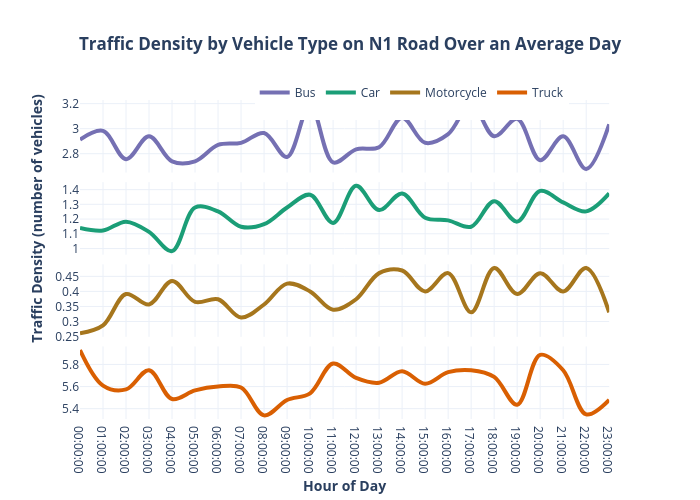
Lnicolet's interactive graph and data of "Traffic Density by Vehicle Type on N1 Road Over an Average Day" is a line chart, showing Bus, Car, Motorcycle, Truck; with Hour of Day in the x-axis. The x-axis shows values from 0 to 23. The y-axis shows values from 5.306280193236716 to 5.963285024154589.