Edit chart
Loading graph
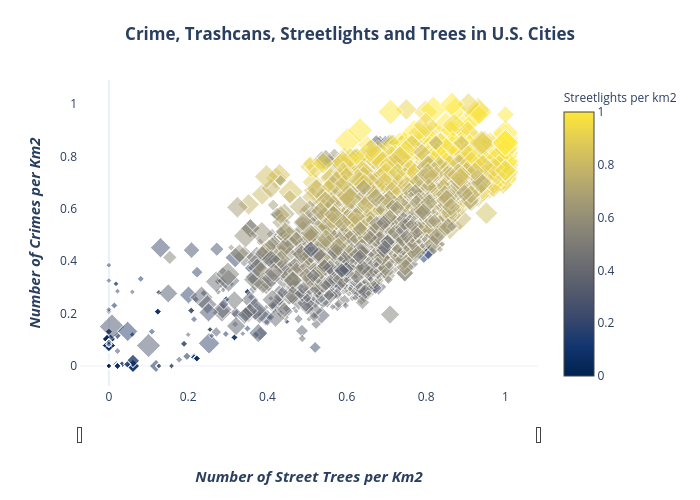
Lnicolet's interactive graph and data of "Crime, Trashcans, Streetlights and Trees in U.S. Cities" is a scattergl, showing ; with Number of Street Trees per Km2 in the x-axis and Number of Crimes per Km2 in the y-axis.. The x-axis shows values from -0.06304608385737459 to 1.07001585588753. The y-axis shows values from -0.07660803699871095 to 1.092186058380553.