Edit chart
Loading graph
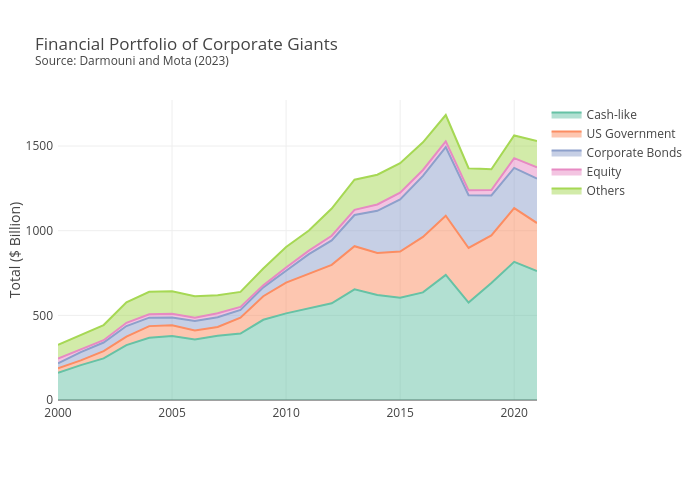
Liramota's interactive graph and data of "Financial Portfolio of Corporate GiantsSource: Darmouni and Mota (2023)" is a filled , showing Cash-like, US Government, Corporate Bonds, Equity, Others; with Total ($ Billion) in the y-axis. The x-axis shows values from 0 to 0. The y-axis shows values from 0 to 0.