Edit chart
Loading graph
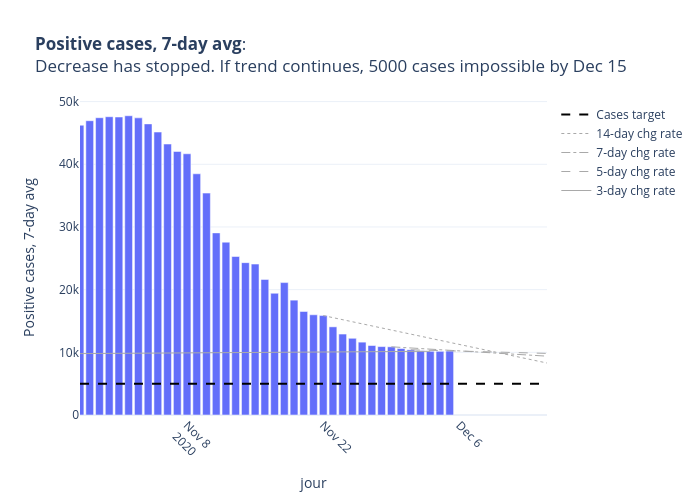
Limegimlet's interactive graph and data of "Positive cases, 7-day avg: Decrease has stopped. If trend continues, 5000 cases impossible by Dec 15" is a , showing , Cases target, 14-day chg rate, 7-day chg rate, 5-day chg rate, 3-day chg rate; with jour in the x-axis and Positive cases, 7-day avg in the y-axis.. The x-axis shows values from 2020-10-28 to 2020-12-15. The y-axis shows values from 0 to 0.