Edit chart
Loading graph
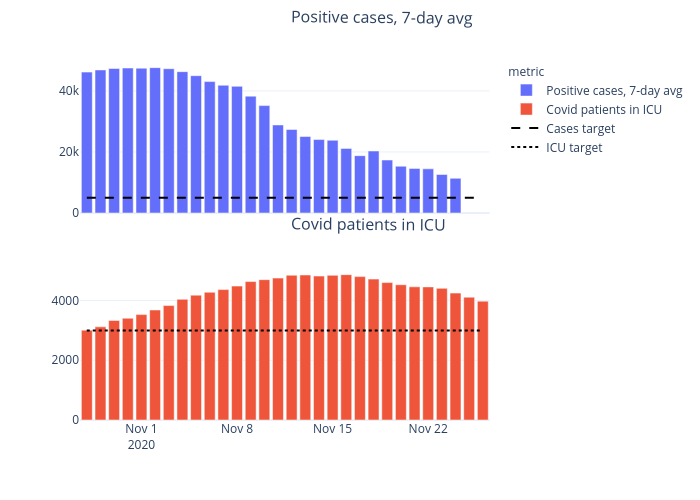
Limegimlet's interactive graph and data of "{} vs {}" is a , showing Positive cases, 7-day avg, Covid patients in ICU, Cases target, ICU target; with {} in the x-axis and {} in the y-axis.. The x-axis shows values from 0 to 0. The y-axis shows values from 0 to 0. This visualization has the following annotations: Covid patients in ICU; Positive cases, 7-day avg