Edit chart
Loading graph
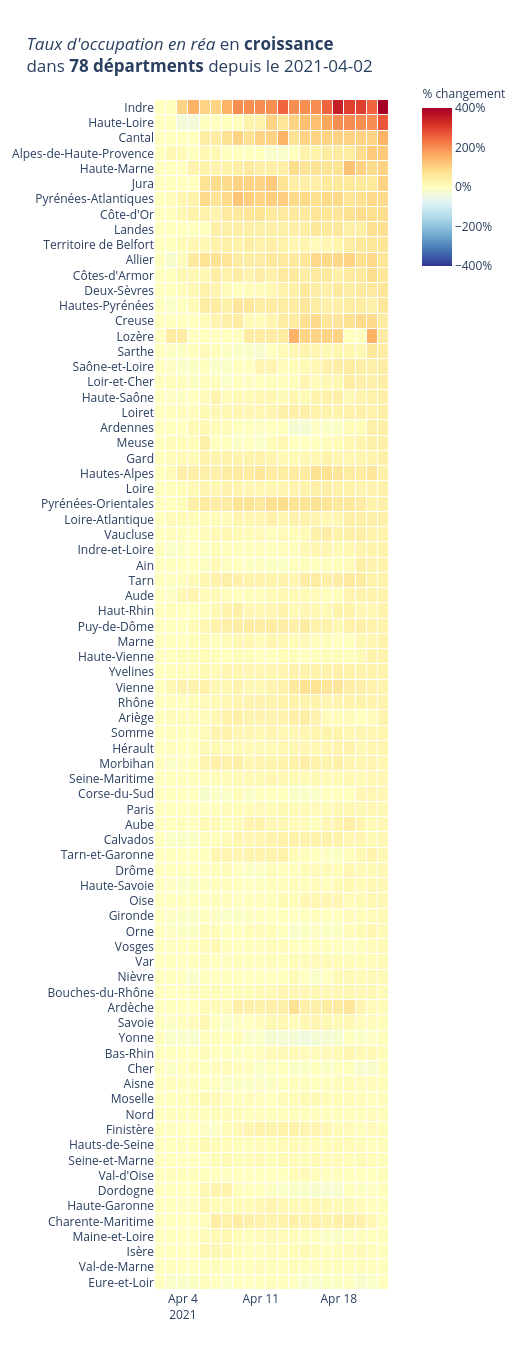
Limegimlet's interactive graph and data of "Taux d'occupation en réa en croissance dans 78 départments depuis le 2021-04-02" is a heatmap. The x-axis shows values from 0 to 0. The y-axis shows values from 0 to 0.