Edit chart
Loading graph
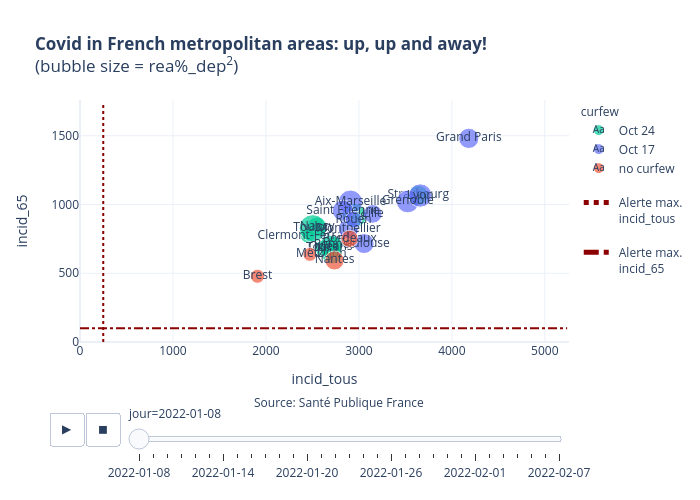
Limegimlet's interactive graph and data of "Covid in French metropolitan areas: up, up and away!(bubble size = rea%_dep2)" is a , showing Oct 24, Oct 17, no curfew, Alerte max.incid_tous, Alerte max.incid_65; with incid_tous in the x-axis and incid_65 in the y-axis.. The x-axis shows values from 0 to 5260.0. The y-axis shows values from 0 to 1760.0. This visualization has the following annotation: Source: Santé Publique France