Edit chart
Loading graph
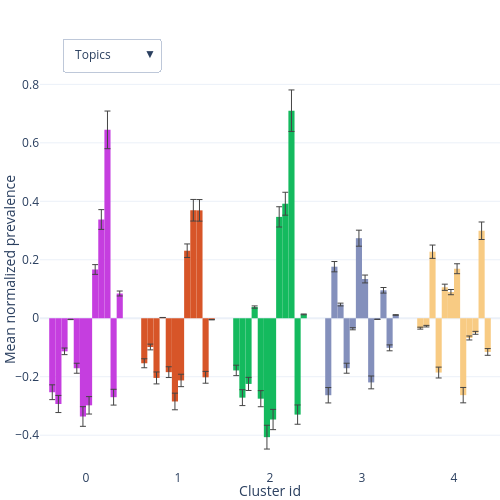
Lgburget's interactive graph and data of "Mean normalized prevalence vs Cluster id" is a grouped bar chartwith vertical error bars, showing experiment_scientist_power_creature, body_vampire_child_night, money_steal_prisoner_bank_drug, team_game_coach_player, ship_alien_earth_attack, murder_police_gang_fight_crime, agent_shoot_military_bomb, band_family_show_music_dream, family_father_mother_daughter_wedding, home_school_night_parent_party_decide, escape_camp_attack_truck, movie_woman_play_character_role; with Cluster id in the x-axis and Mean normalized prevalence in the y-axis.. The x-axis shows values from -0.5 to 4.5. The y-axis shows values from -0.5155758383339643 to 0.8491113802741038.