Edit chart
Loading graph
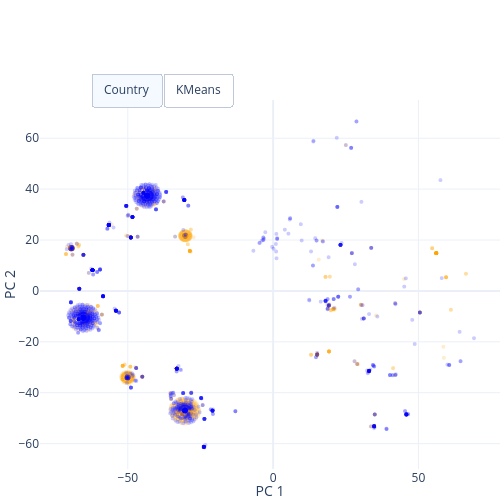
Lgburget's interactive graph and data of "PC 2 vs PC 1" is a scatter chart, showing Country; with PC 1 in the x-axis and PC 2 in the y-axis.. The x-axis shows values from -80.21472874809714 to 78.06724492241355. The y-axis shows values from -69.96013977330759 to 75.01298095983103. This visualization has the following annotation: Color: