Edit chart
Loading graph
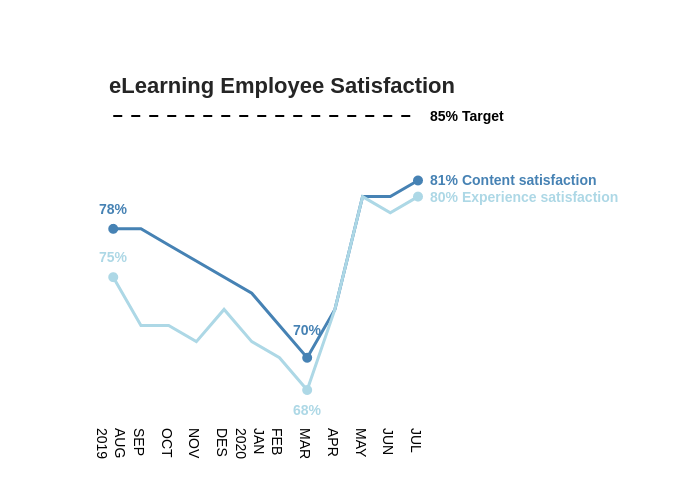
Lewiuberg's interactive graph and data of "Content satisfaction, Experience satisfaction, Target" is a line chart, showing Content satisfaction, Experience satisfaction, Target. The x-axis shows values from 0 to 0. The y-axis shows values from 0 to 0. This visualization has the following annotations: eLearning Employee Satisfaction; 78%; 70%; 81% Content satisfaction; 75%; 68%; 80% Experience satisfaction; 85% Target