Edit chart
Loading graph
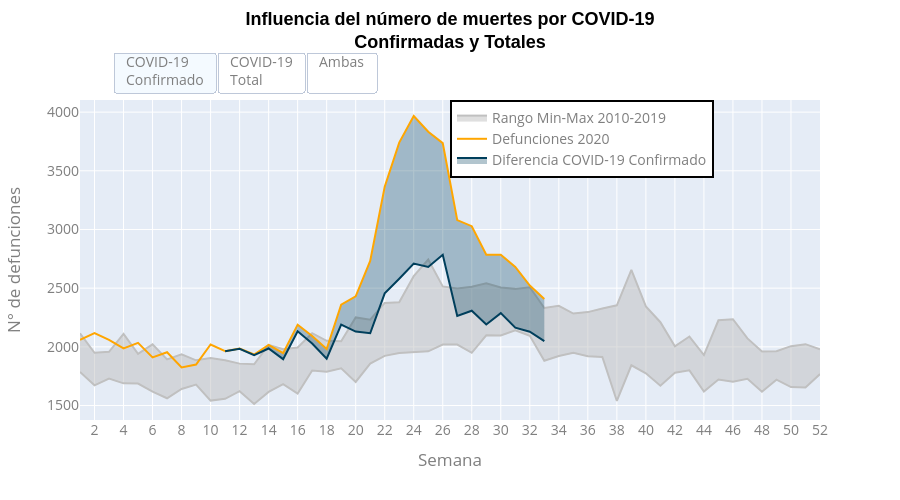
Leoparadap's interactive graph and data of "Influencia del número de muertes por COVID-19Confirmadas y Totales" is a line chart, showing Rango Min-Max 2010-2019, Defunciones 2020, Diferencia COVID-19 Confirmado; with Semana in the x-axis and N° de defunciones in the y-axis.. The x-axis shows values from 0 to 0. The y-axis shows values from 0 to 0.