Edit chart
Loading graph
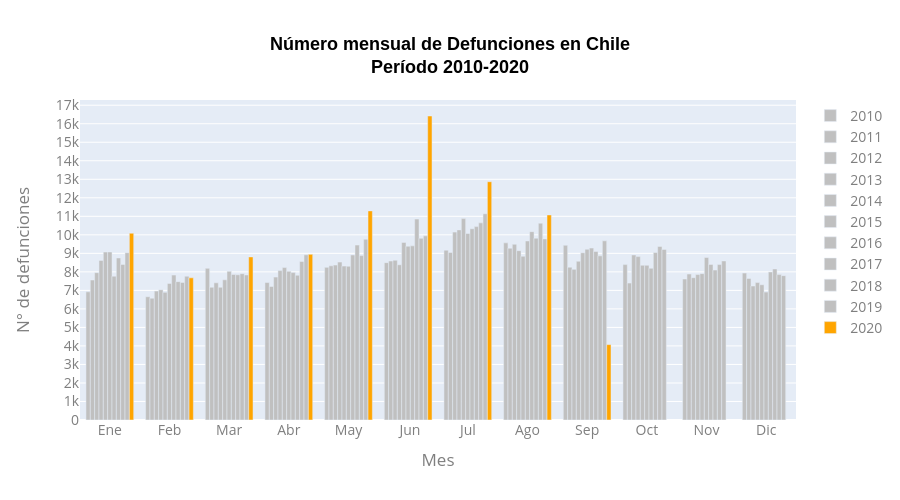
Leoparadap's interactive graph and data of "Número mensual de Defunciones en ChilePeríodo 2010-2020" is a bar chart, showing 2010, 2011, 2012, 2013, 2014, 2015, 2016, 2017, 2018, 2019, 2020; with Mes in the x-axis and N° de defunciones in the y-axis.. The x-axis shows values from 0 to 0. The y-axis shows values from 0 to 0.