Edit chart
Loading graph
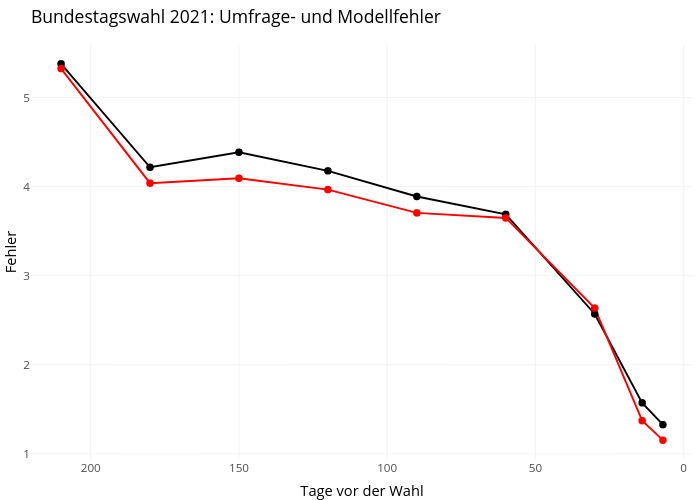
Leon.heckmann's interactive graph and data of "Bundestagswahl 2021: Umfrage- und Modellfehler" is a line chart; with Tage vor der Wahl in the x-axis and Fehler in the y-axis.. The x-axis shows values from -220.15 to 3.15. The y-axis shows values from 0.942255190035464 to 5.58957514968085.