Edit chart
Loading graph
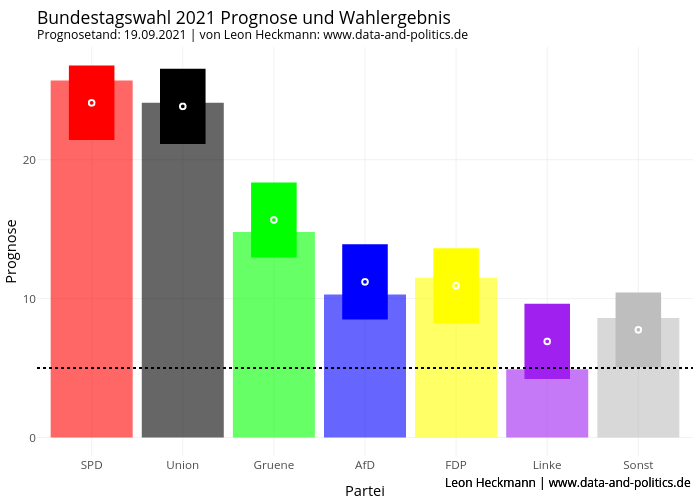
Leon.heckmann's interactive graph and data of "Bundestagswahl 2021 Prognose und WahlergebnisPrognosetand: 19.09.2021 | von Leon Heckmann: www.data-and-politics.de" is a filled line chart, showing SPD, Union, Gruene, AfD, FDP, Linke, Sonst, SPD, Union, Gruene, AfD, FDP, Linke, Sonst, SPD, Union, Gruene, AfD, FDP, Linke, Sonst, SPD, Union, Gruene, AfD, FDP, Linke, Sonst; with Partei in the x-axis and Prognose in the y-axis.. The x-axis shows values from 0.4 to 7.6. The y-axis shows values from -1.33888086085004 to 28.1164980778508. This visualization has the following annotations: Leon Heckmann | www.data-and-politics.de; Leon Heckmann | www.data-and-politics.de