Edit chart
Loading graph
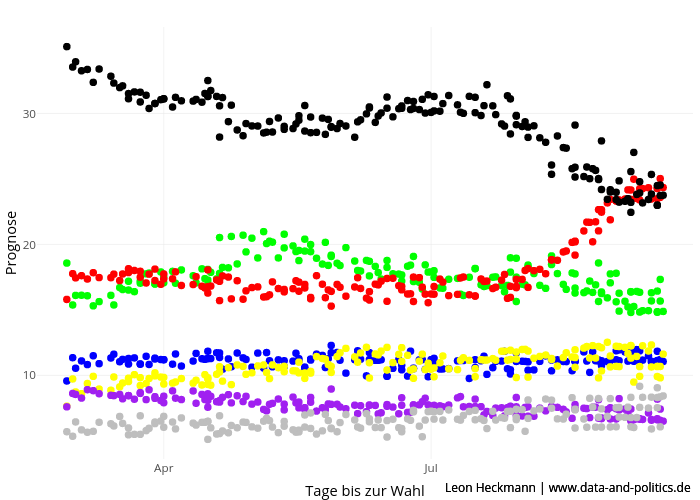
Leon.heckmann's interactive graph and data of "Prognose vs Tage bis zur Wahl" is a scatter chart, showing AfD, FDP, Grüne, Linke, Sonst., SPD, Union; with Tage bis zur Wahl in the x-axis and Prognose in the y-axis.. The x-axis shows values from 18674.85 to 18898.15. The y-axis shows values from 3.61701951770839 to 36.5991895467758. This visualization has the following annotations: Leon Heckmann | www.data-and-politics.de; Leon Heckmann | www.data-and-politics.de