Edit chart
Loading graph
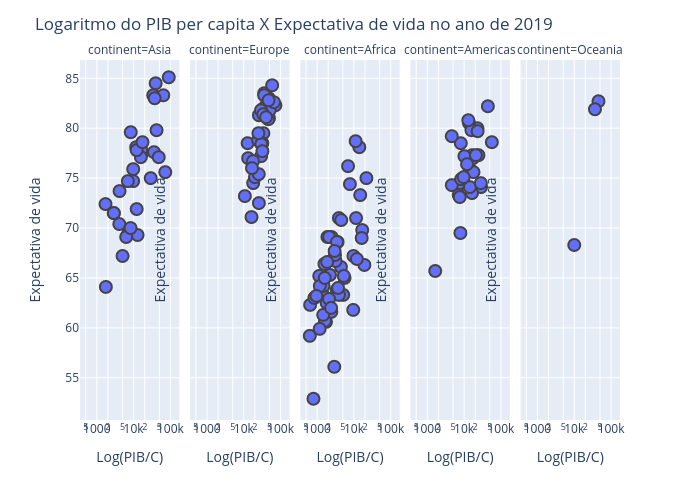
Leomaxil11's interactive graph and data of "Logaritmo do PIB per capita X Expectativa de vida no ano de 2019" is a scatter chart, showing , , , , ; with Log(PIB/C) in the x-axis and Expectativa de vida in the y-axis.. The x-axis shows values from 0 to 0. The y-axis shows values from 0 to 0. This visualization has the following annotations: continent=Asia; continent=Europe; continent=Africa; continent=Americas; continent=Oceania