Edit chart
Loading graph
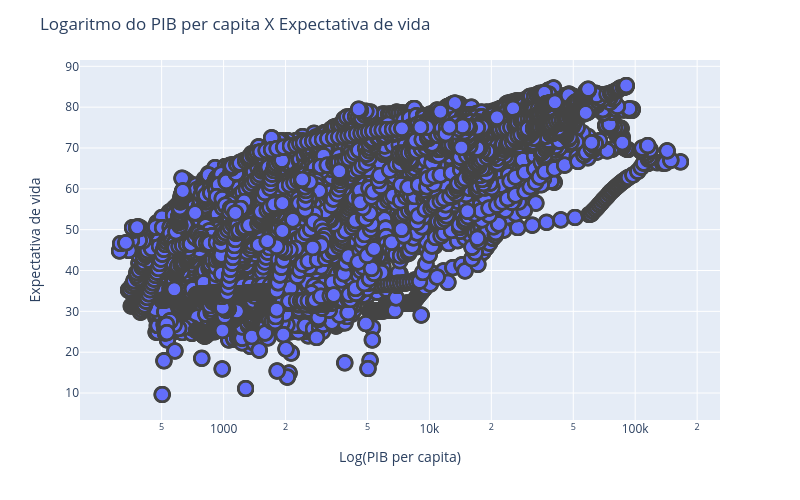
Leomaxil11's interactive graph and data of "Logaritmo do PIB per capita X Expectativa de vida" is a scattergl; with Log(PIB per capita) in the x-axis and Expectativa de vida in the y-axis.. The x-axis shows values from 0 to 0. The y-axis shows values from 0 to 0.