Edit chart
Loading graph
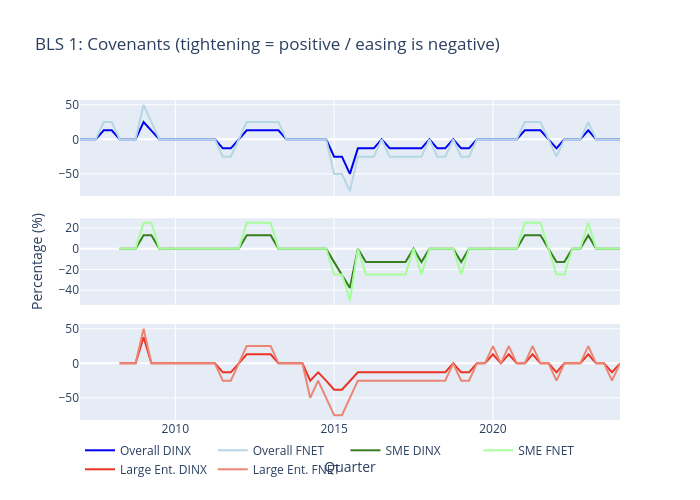
Lennybrans's interactive graph and data of "BLS 1: Covenants (tightening = positive / easing is negative)" is a line chart, showing Overall DINX, Overall FNET, SME DINX, SME FNET, Large Ent. DINX, Large Ent. FNET; with Quarter in the x-axis. The x-axis shows values from 2007-01-01 to 2024-01-01. The y-axis shows values from -81.94444444444444 to 56.94444444444444.