Edit chart
Loading graph
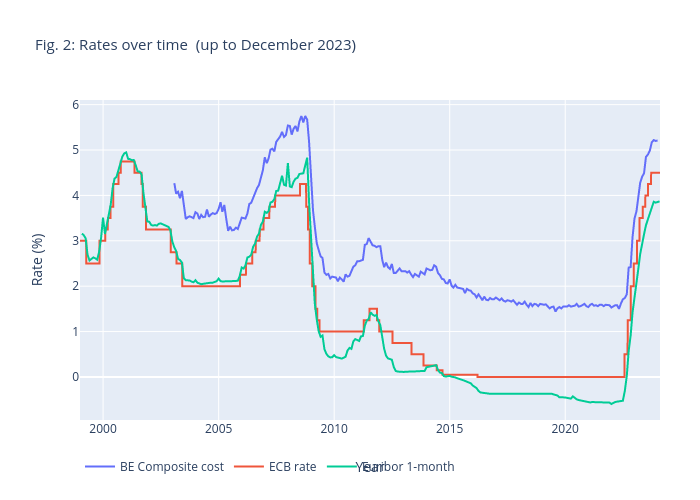
Lennybrans's interactive graph and data of "Fig. 2: Rates over time (up to December 2023)" is a line chart, showing BE Composite cost, ECB rate, Euribor 1-month; with Year in the x-axis and Rate (%) in the y-axis.. The x-axis shows values from 1999-01-01 to 2024-02-07. The y-axis shows values from -0.9488722222222223 to 6.102572222222222.