Edit chart
Loading graph
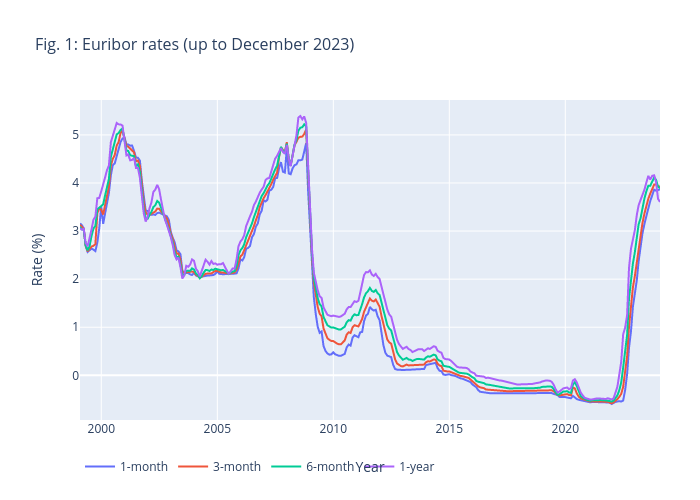
Lennybrans's interactive graph and data of "Fig. 1: Euribor rates (up to December 2023)" is a line chart, showing 1-month, 3-month, 6-month, 1-year; with Year in the x-axis and Rate (%) in the y-axis.. The x-axis shows values from 1999-01-31 to 2024-01-31. The y-axis shows values from -0.9290500000000002 to 5.72595.