Edit chart
Loading graph
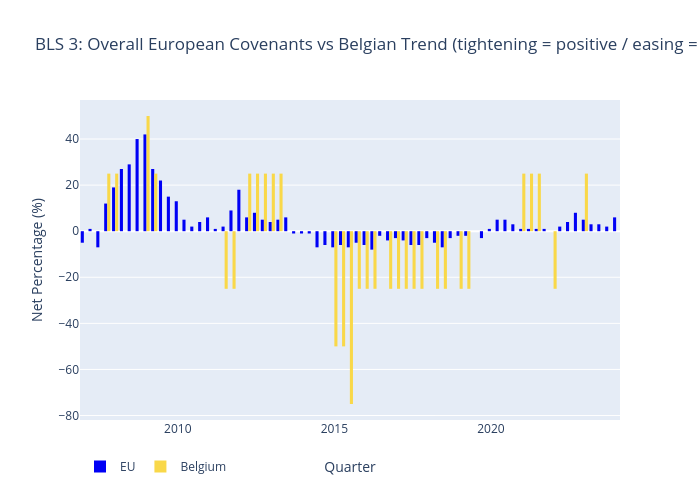
Lennybrans's interactive graph and data of "BLS 3: Overall European Covenants vs Belgian Trend (tightening = positive / easing = negative)" is a bar chart, showing EU vs Belgium; with Quarter in the x-axis and Net Percentage (%) in the y-axis.. The x-axis shows values from 2006-11-17 to 2024-02-15. The y-axis shows values from -81.94444444444444 to 56.94444444444444.