Edit chart
Loading graph
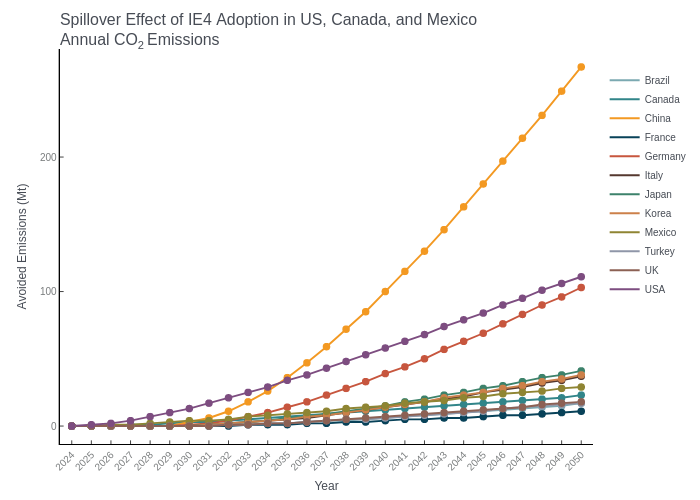
Lboucher12's interactive graph and data of "Spillover Effect of IE4 Adoption in US, Canada, and MexicoAnnual CO2 Emissions" is a line chart, showing Brazil, Canada, China, France, Germany, Italy, Japan, Korea, Mexico, Turkey, UK, USA, Brazil, Canada, China, France, Germany, Italy, Japan, Korea, Mexico, Turkey, UK, USA; with Year in the x-axis and Avoided Emissions (Mt) in the y-axis.. The x-axis shows values from 0.3999999999999999 to 27.6. The y-axis shows values from -13.35 to 280.35.